Wednesday, April 1, 2009

Lab 1: Line Simplification

Line Simplification Map:
The purpsose of this map is to show how generalization tool works in ArcMap. The line simplification removes points to make the line smoother. I really didn’t know what to change on this map other than some very slight adjustments to map element size. As seen below there is very little difference.


Lab 2: Freehand Maps


Lab 2 Redesign:
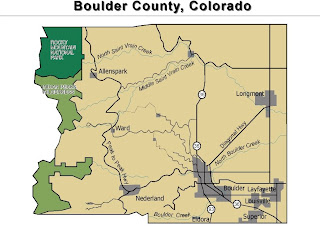
Freehand Map:
The freehand map got us acquainted with the program. It is basically a reference map of Boulder County, Colorado. This isn’t the easiest program to use but it has some neat features. I idid change a bit for better clarity of the map features. I lightened the shade of grey that I used to represent the cities and used a drop shadow to make them stand out. I used an inner glow feature for the parks, also to make them stand out more against the majority of the county background. I changed the background color so that the colors weren’t so jarring and put a neatline around the map. Other than that, I didn’t
change much. I liked the text placement so
I didn’t’ mess with it too much.


Lab 3: Data Classifications

Lab 3 Redesign:
This map represents four different types of data classification. I chose to use the percentage of non-farm rural population in counties of the state of Washington. Each map shows the data differently. The purpose is to find which one best represents the data. Despite reprojecting the maps several times, my scale bar never worked correctly. Even when I went back to redesign a little bit. However, I did put a frameline to better contain the map elements and to eliminate too much white space. I made the legends for each map slightly large to maximise use of white space and condensed the map title slightly to take less attention off of it and to put more focus on the actual map features.